We reveal initial findings on the cost of driving in the UK today.
The survey was communicated to Electric Road’s database and social media audiences.
These findings are based on submissions received from 11th January 2024 to 27th February 2024. The total respondent base was 1,940 achieving a 66.5% completion rate. We will continue to promote this survey and publish findings on an ongoing basis.
Fuel type of vehicle
Given our core audience of EV owners, we have a disproportionate number of EV respondents to this survey currently. The UK breakdown by fuel type from June 2023 is as follows: Petrol (57%), Diesel (34%), Hybrid (6%), Fully Electric (2%) & LPG (0.1%), source: Nimblefins.co.uk.

Public charging – happy or unhappy?
With 1 being ‘really not happy’ and 5 being ‘very happy’ clearly the consensus is that public charging is too expensive. Removing the 20% VAT would help!

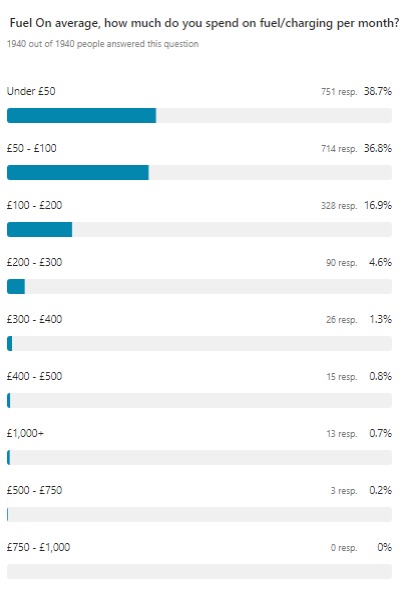
Monthly spend on fuel
Over 50% of respondents are paying between £50-£200 per month on their primary vehicle. We’d love to know what those 13 people spending over £1,000 on fuel each month are driving or what miles they are covering!
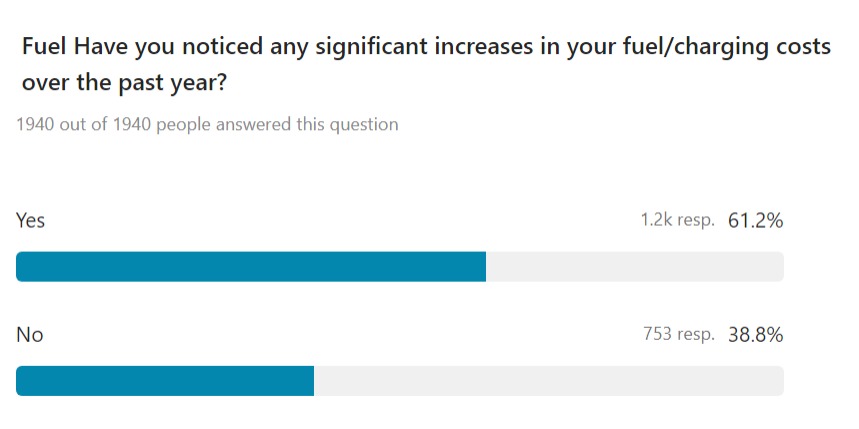
Fuel – significant increases?
Maintenance & servicing – annual costs
These results don’t surprise us although we’d like to know what those 224 people are driving to get all maintenance & servicing under £50 a year. Maybe it’s who you know!

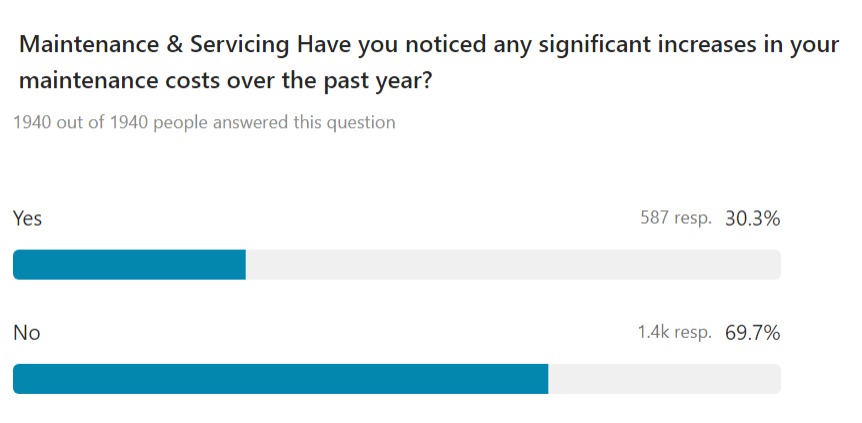
Maintenance & servicing – significant increases?
Clearly, dealers & garages have largely held their prices or charged fairly negligible price increases in the past year.
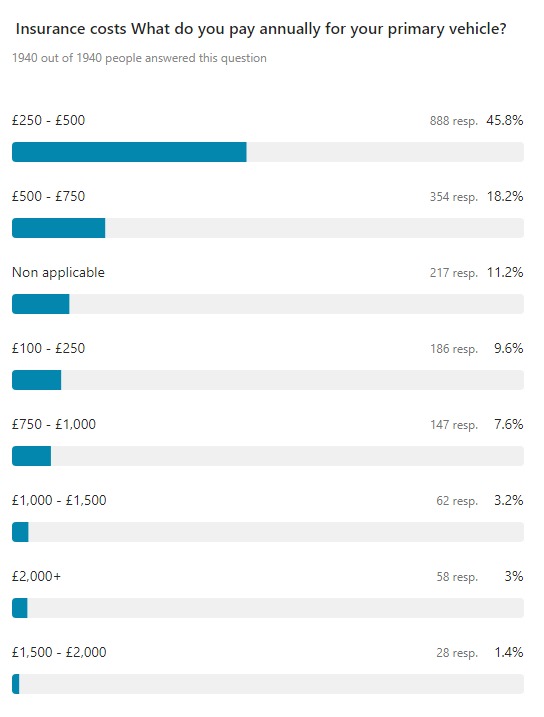
Insurance – annual costs
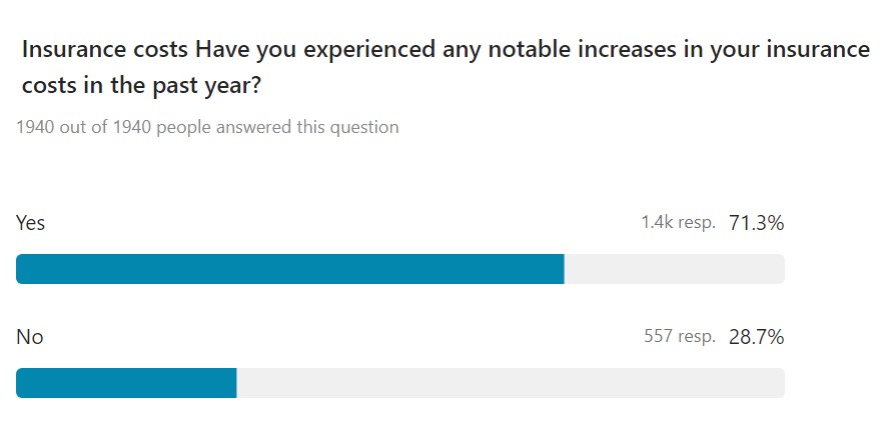
Insurance – significant increases?
Are we surprised?
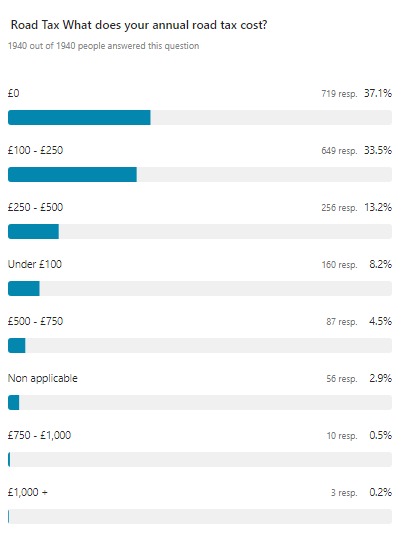
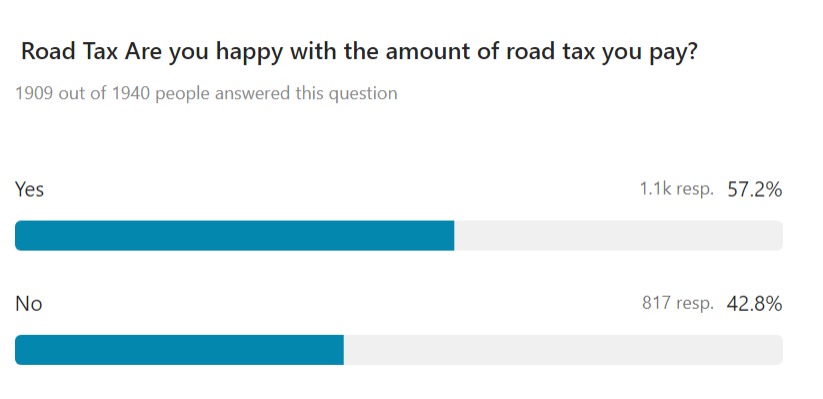
Road tax – annual cost
Road tax – happy with amount pay?
We can only conclude that EV drivers must love paying £0 along with others paying lesser amounts to use public roads.
Public car parks – happy with prices?
With 1 being ‘really not happy’ and 5 being ‘very happy’ we can fully understand the overall rating of 2.4 given our varied experiences around the UK.

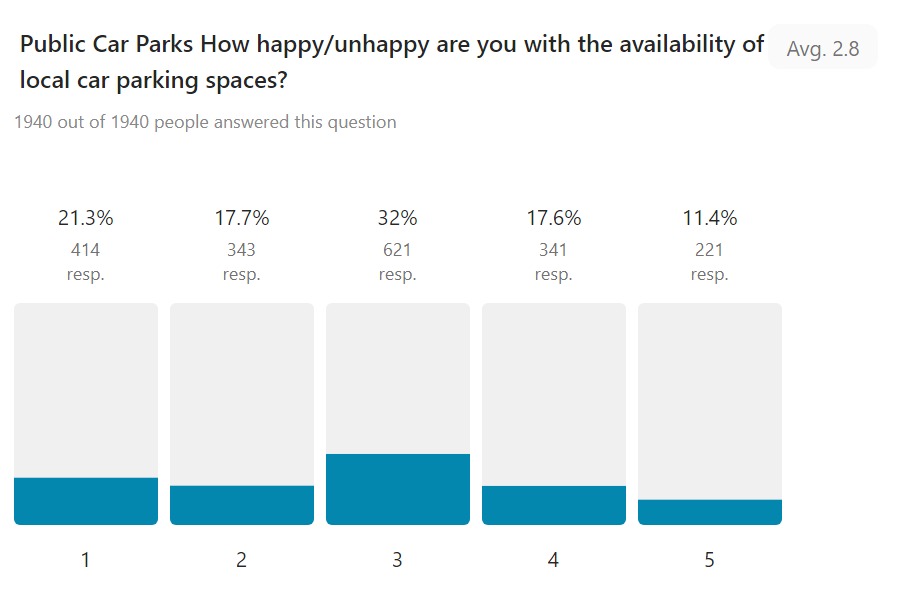
Public car parks – happy with availability?
Availability of public car parks isn’t as bad as we anticipated from the survey results. Obviously, it’s down to personal experience and maybe specifically where you live & work.
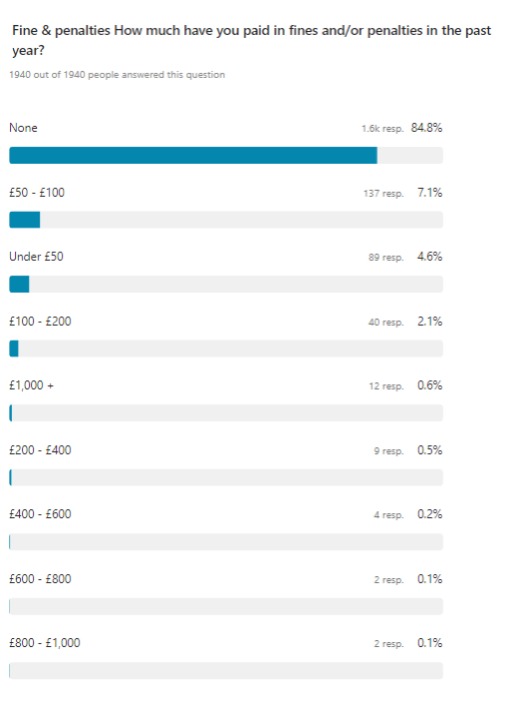
Fines & penalties
Very impressed on the approx. 85% who have incurred zero fines or penalties in the past year!
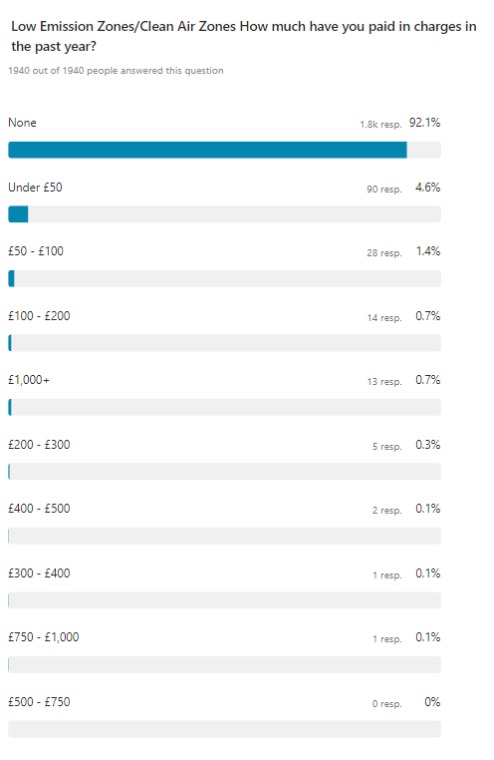
Low emission & clean air zones – charges
We do feel for those 13 respondents who have allegedly paid over £1,000 in the past year.
Overall satisfaction with cost of driving
With 1 being ‘really not satisfied’ and 5 being ‘very satisfied’, the current overall satisfaction rating of 3.4 does surprise us somewhat as we thought this would be lower. Certainly for just over 50% of respondents they are happy with their current cost of motoring in the UK.

What do you think needs to change (if anything) to lower the cost of motoring in the UK?
Just some of the feedback we’ve received from the survey:
‘Tax on fuel needs to be reduced. Greedy energy companies should be heavily fined when it is clear they are profiteering.’
‘EVERY road user to pay per mile.’
‘Make everyone who uses the road to pay road tax. I feel it’s unfair that some people do not pay at all, I think it should be about £150 for everyone.’
‘Remove VAT on diesel and petrol.’
‘I think that when you drive accident-free over 55 years and still have to pay high premiums the insurers have got it wrong. I am still paying over £550 per annum having probably driven over 2 million miles.’
‘The cost per kW/h needs to be regulated. I don’t mind paying a REASONABLE premium but not 4 times the cost per unit. Also, the cost of of fast charges vs normal is wrong. Petrol stations don’t charge lorries more per litre just because they use the faster pump. After all, the energy (be it liquid form or electrons) still costs the same to buy in.’
‘The councils need to sort out the disgusting state of the road surfaces, a lot of damage is done to car tyres, wheels and suspension, which is very costly.’
‘Better charging infrastructure and lower buying costs for electric vehicles.’
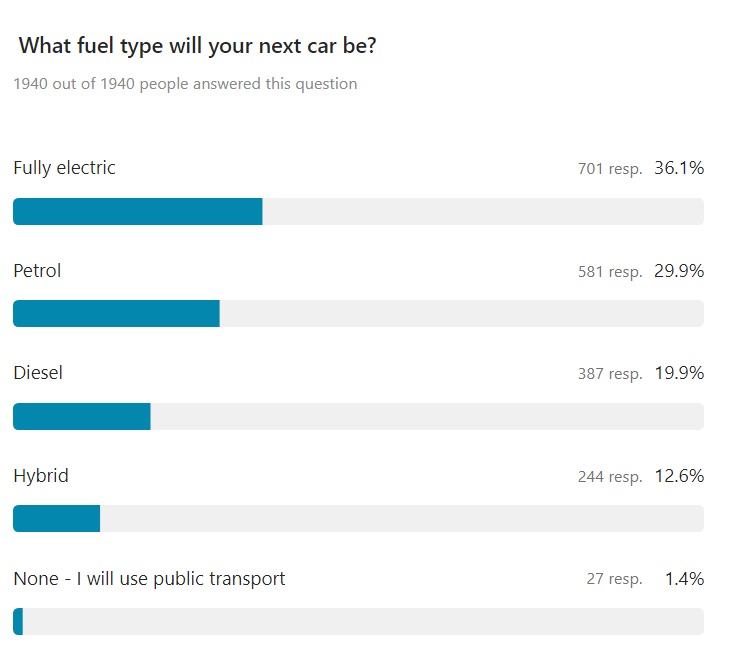
Next car – fuel type
Comparing current fuel type owned (1st question) with these answers, there is a significant swing towards Hybrid (79% increase albeit a smaller respondent base) and a slightly smaller swing to Fully electric (2%).